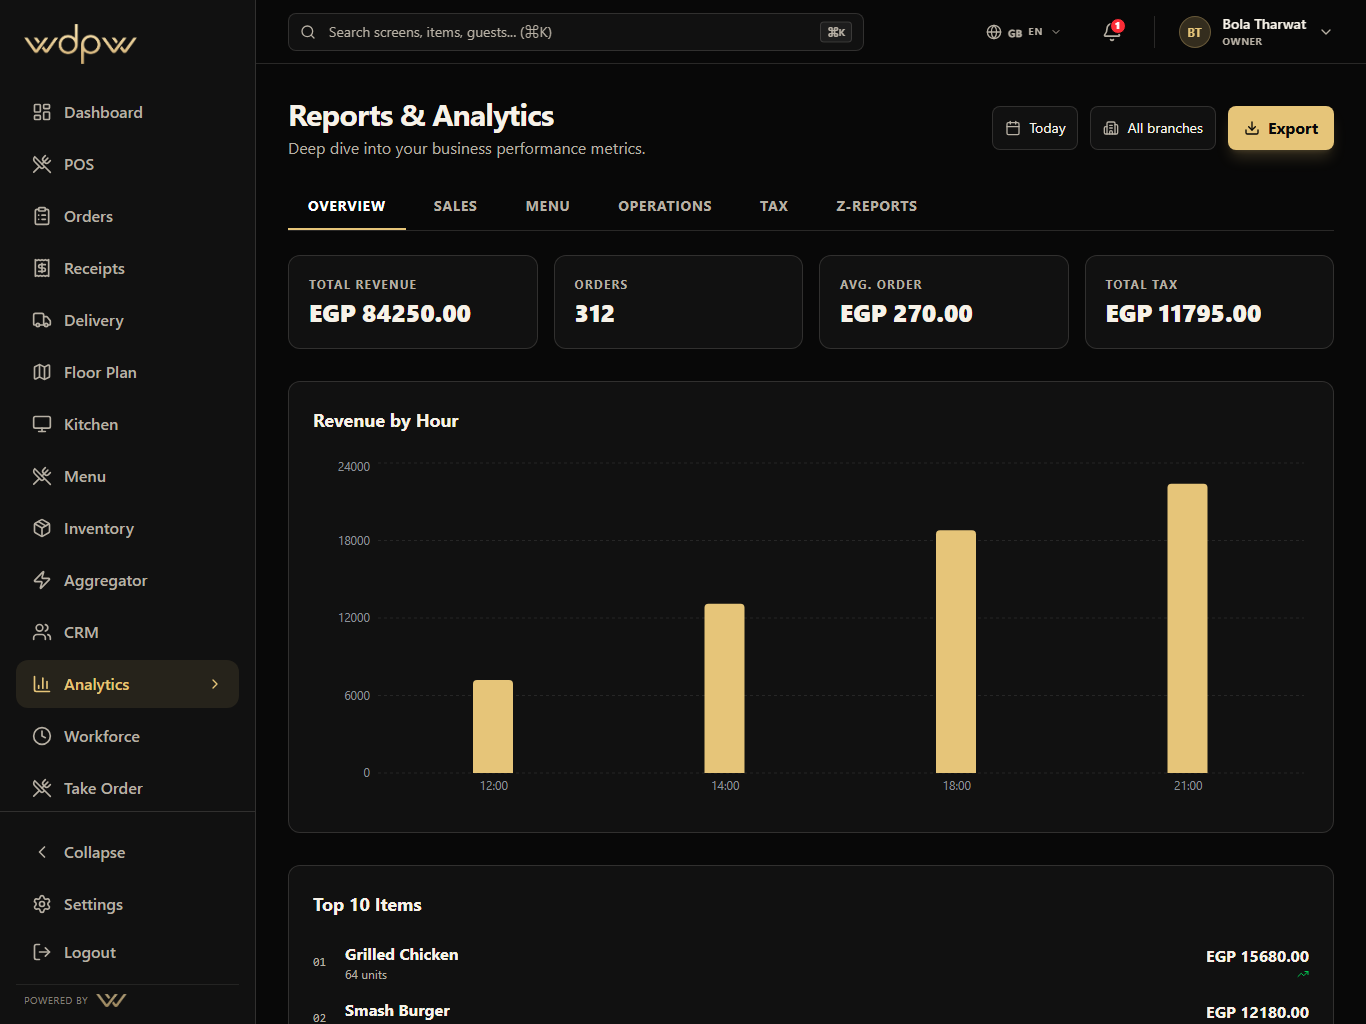
Overview
Managers start with the shift picture.
Revenue, order count, average order, tax, hourly sales, top items, and channel pressure are visible from the overview.
Revenue and orders
Hourly sales
Top items
Operational reporting across sales, labor, item mix, delivery channels, stock risk, cashier closeout, tax, and branch performance.
Daily
sales recap
Branch
comparison
Menu
mix insight
Analytics turns service activity into manager-ready views for revenue, orders, average check, channel mix, branch health, and closeout.
Daily
sales recap
Branch
comparison
Menu
mix insight
Capture service
Normalize data
Group by branch
Review reports
Act quickly
These are the smaller features hiding inside Analytics: the controls buyers ask about after they understand the headline module.
Overview
Revenue, order count, average order, tax, hourly sales, top items, and channel pressure are visible from the overview.
Revenue and orders
Hourly sales
Top items
Each Analytics module pairs the primary screen with deeper app states, captured in iPad landscape with the WDPW site palette applied.
Sales, menu, operations, tax, and Z-report tabs
Branch and date filters for manager review
Daily sales recap and channel performance
Labor, stock risk, and operational snapshots
Export and scheduled report foundation
Cashier closeout and ETA tax-compliance visibility
A touch-first POS for menu browsing, modifiers, discounts, open checks, table handoff, payment, refunds, and cashier closeout.
View moduleIngredient stock, par levels, purchase orders, suppliers, low-stock signals, and menu availability control for kitchen and manager teams.
View moduleDelivery marketplace mapping, availability sync, webhook inbox, outbound status push, and global delivery controls in one operations hub.
View moduleGuest profiles, loyalty points, member tiers, visit history, rewards, and customer context connected to real restaurant orders.
View module